Portfolio Insights
Detailed Portfolio Analysis
*Screens shown are simulated. Past or displayed performance is not guaranteed and is not indicative of future returns
-
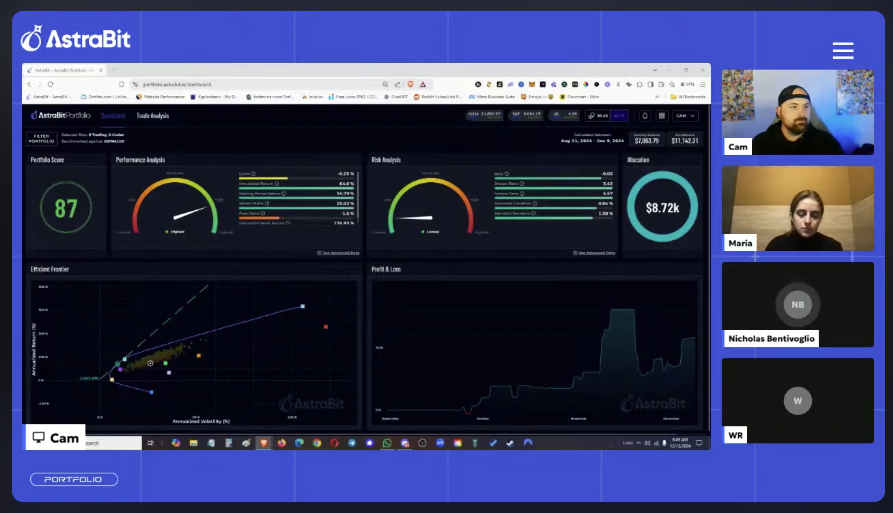
 Track and manage your portfolio in real-time.
 -
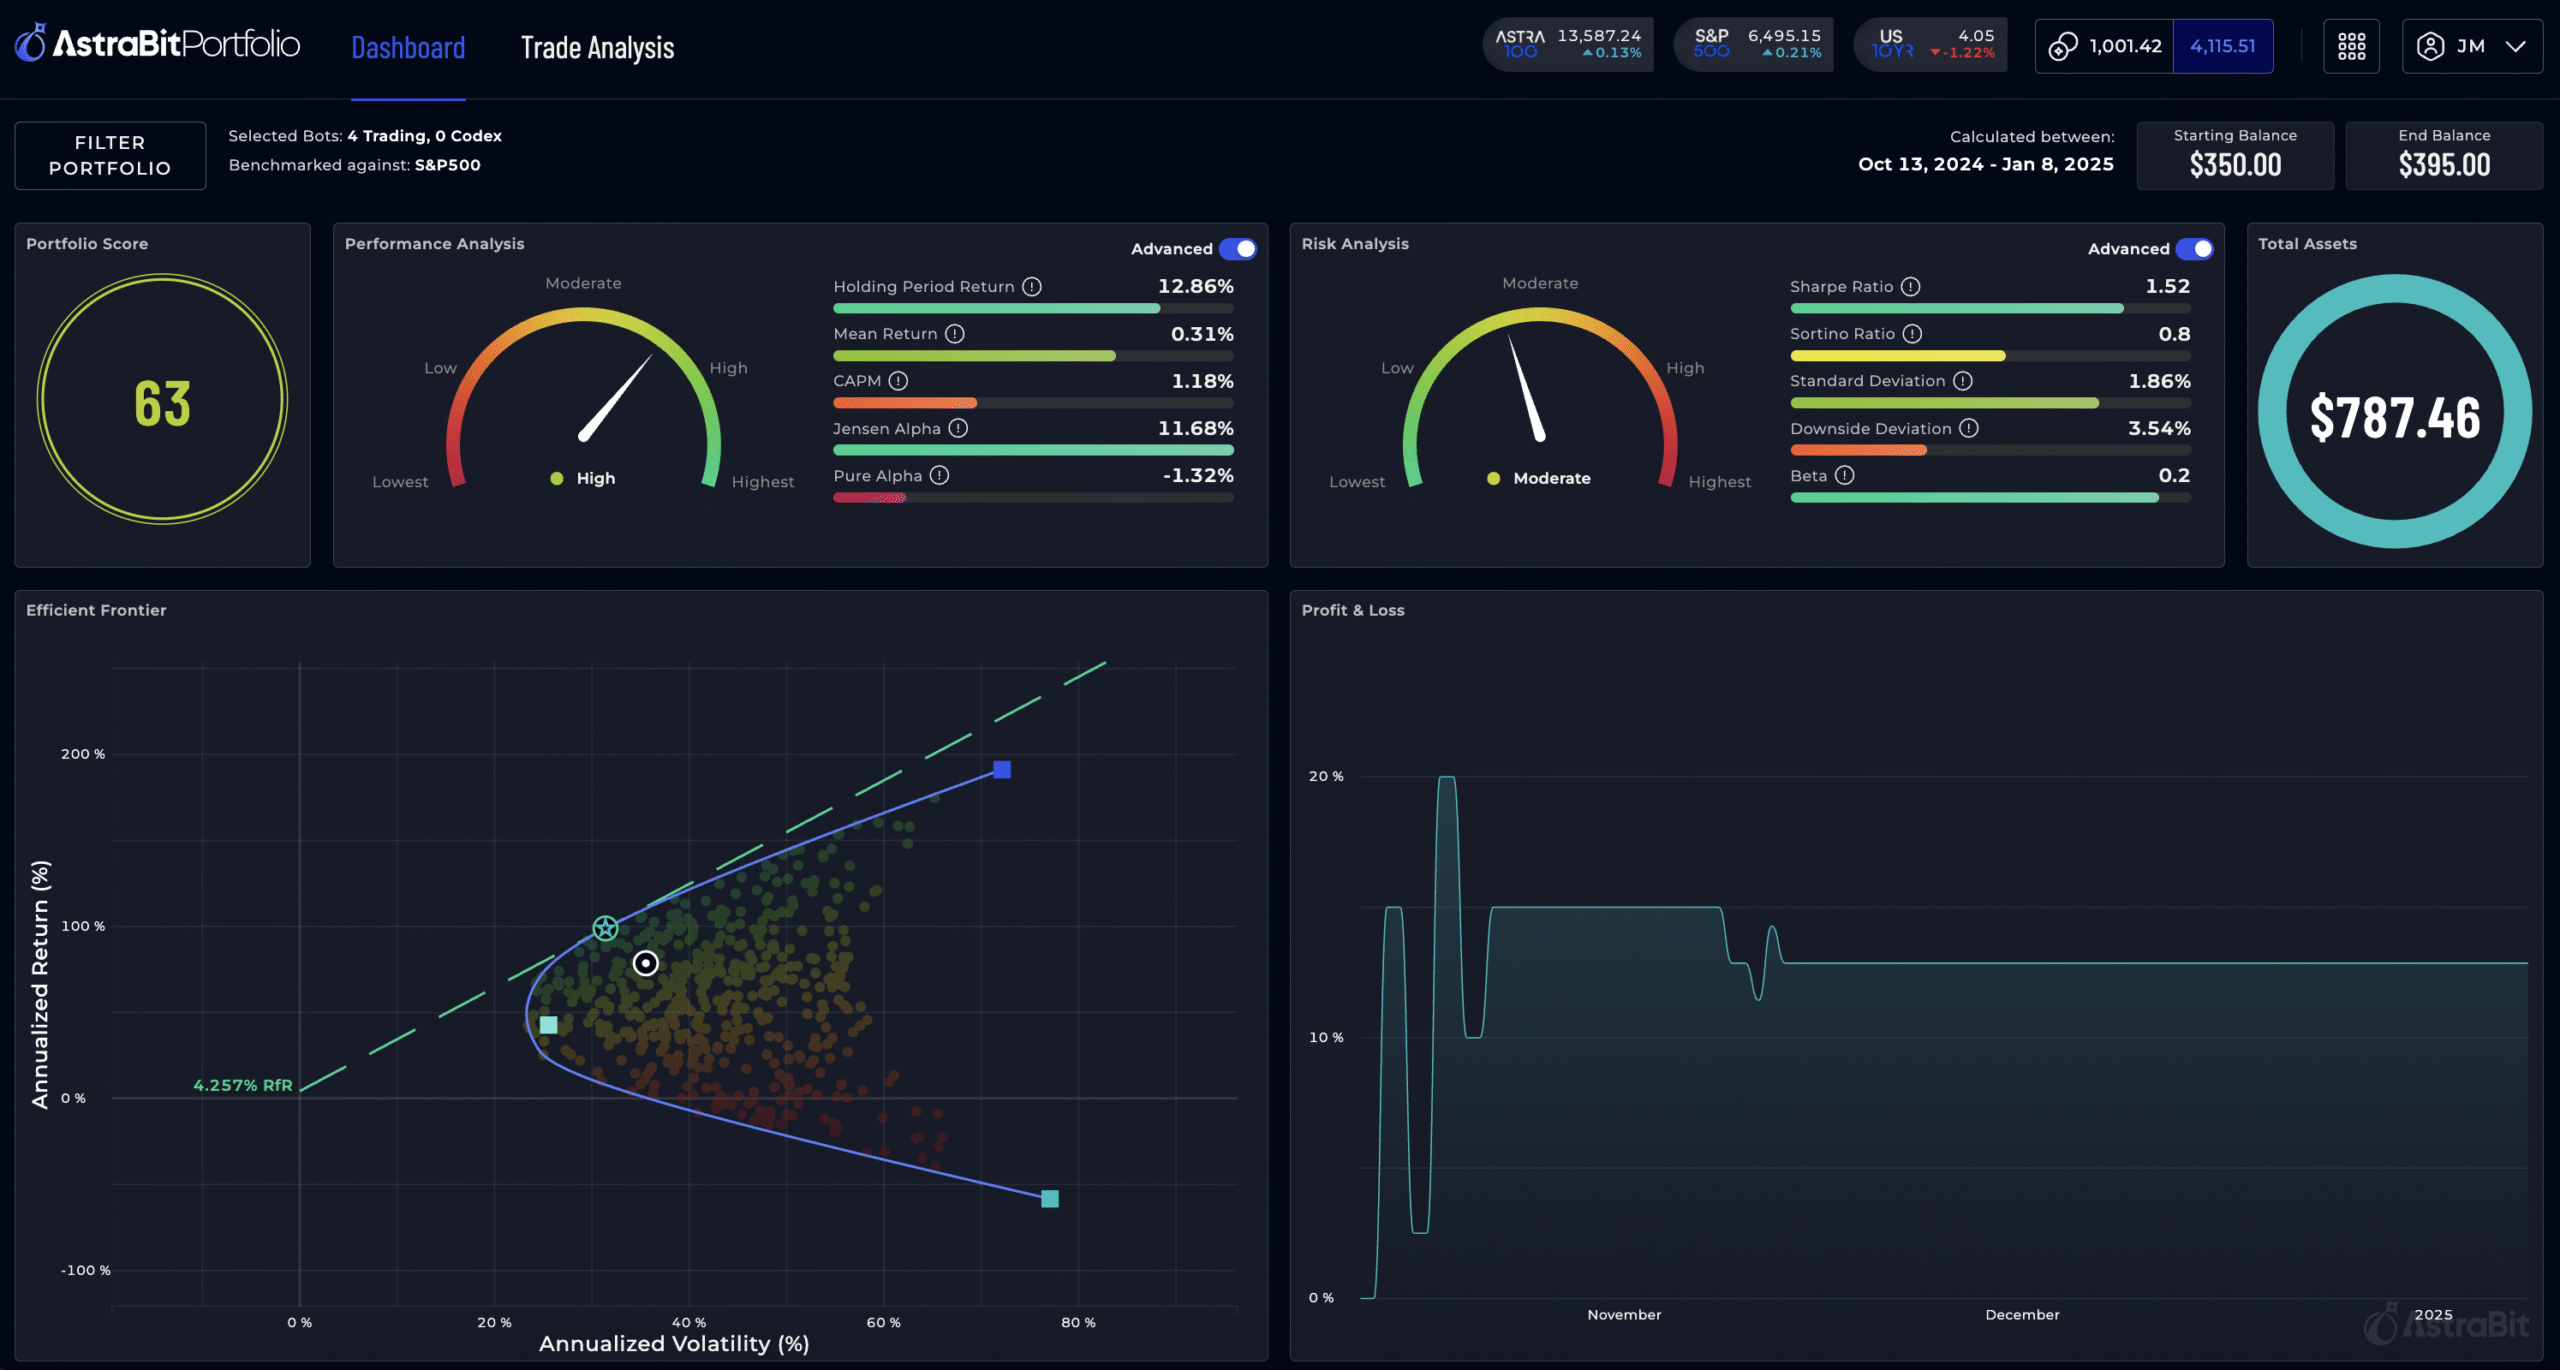
Gain deep insights with detailed analytics and performance metrics.
-
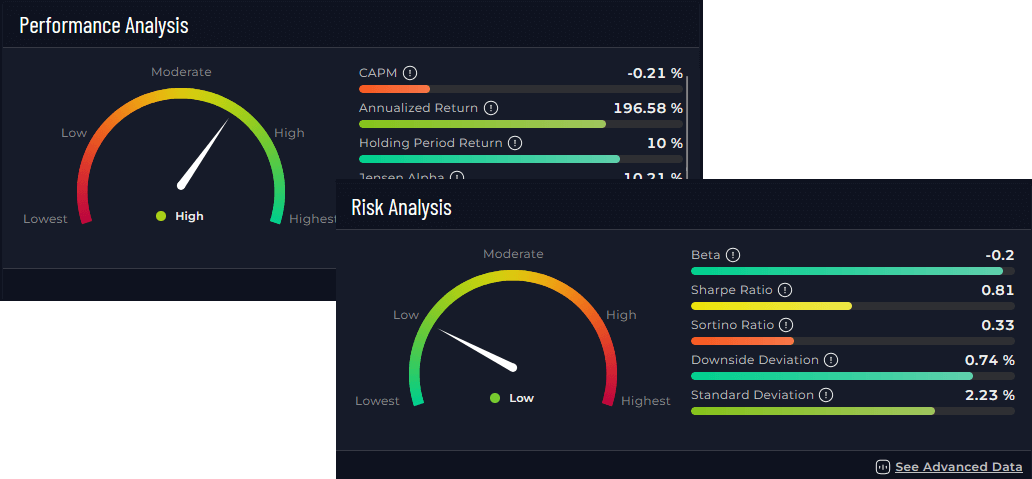
Evaluate performance and risk management factors.
-
Seamlessly integrate with our integrated exchanges for effortless tracking.
Informative Portfolio Analysis Tools
Access tools designed to support both new and experienced traders. This all-in-one solution offers insights that may help you review and evaluate your strategies.
Whether you are hedging, diversifying, or monitoring positions, these tools provide detailed breakdowns and intuitive dashboards to support your trading approach.

Powerful Features at Your Fingertips
Identify Your Best Performers
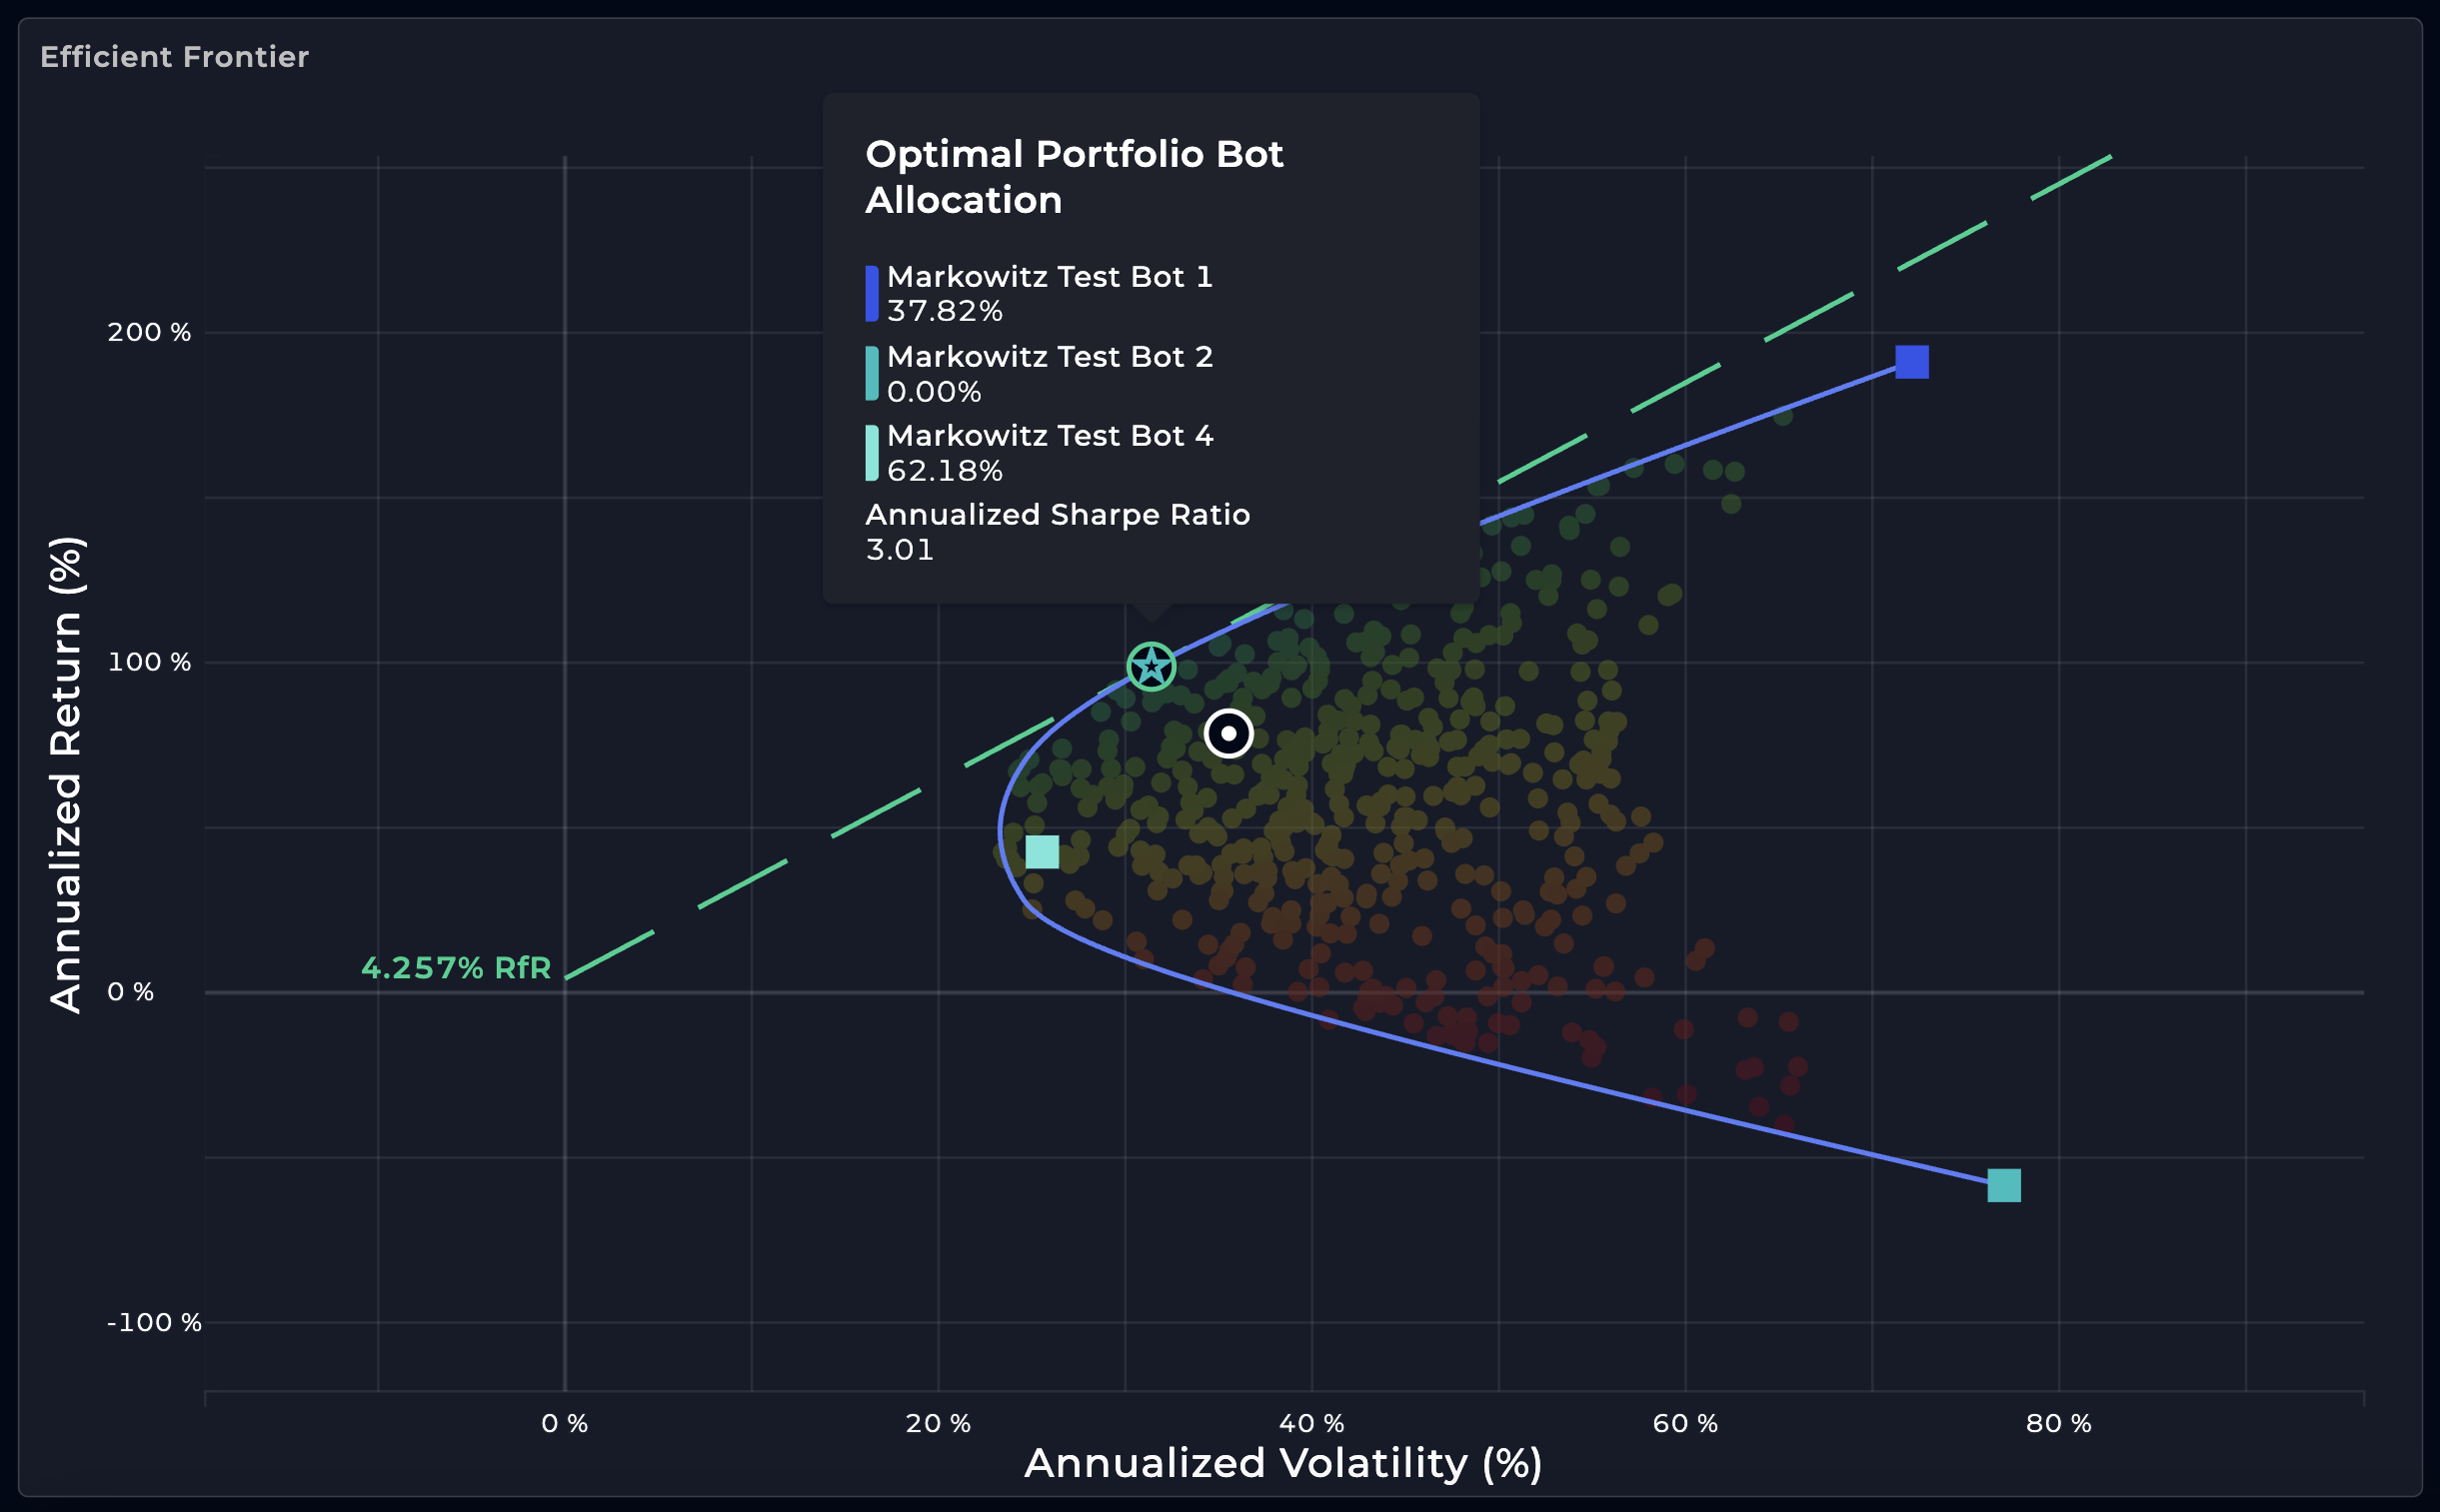
Dive Deep into Analysis
Compare Your Bots & Assets
Overlay Your Performance
 *Screens shown are simulated. Past or displayed performance is not guaranteed and is not indicative of future returns.
 *Screens shown are simulated. Past or displayed performance is not guaranteed and is not indicative of future returns.
 *Screens shown are simulated. Past or displayed performance is not guaranteed and is not indicative of future returns.
 *Screens shown are simulated. Past or displayed performance is not guaranteed and is not indicative of future returns.
Frequently Asked Questions
What is the dashboard used for?
The dashboard helps you track, analyze, and compare your trading strategies (bots) in one place. The dashboard helps you track strategies, measure risk factors, and compare results against benchmarks such as the S&P 500 or ASTRA 100.
→ To learn more, visit our [AstraHelp Center Article]
What assets or bots can I compare?
Under the Trade Analysis section, you can compare: (1) Trading bots and strategies available on AstraBit, (2) market benchmarks (e.g., S&P 500, ASTRA 100), and (3) exchange pairs (e.g., XRP/USDT, SOL/USDT, BTC/USDT) via Codex Bots.
→ To learn more, visit our [AstraHelp Center Article]
What does “benchmarked against” mean?
Your portfolio or asset’s results are shown relative to a chosen benchmark (like the S&P 500), providing context for comparison with the broader market. Comparisons to benchmarks are for informational purposes only and do not predict or guarantee future performance.
Can I see advanced analytics?
You can toggle the Advanced view to see detailed metrics (Sharpe Ratio, Beta, CAPM, Alpha, etc.). If preferred, you can use the simplified view with core charts and gauges.
Get Help with Portfolio Tools
AstraHelp – Our Help Center
Find product documentation, FAQs, troubleshooting guides, and submit support requests.

Chat with us on Discord
Connect with AstraBit team members and other traders on our Discord channel for quick answers.
 Join channel

AstraGuides Video Tutorials
From getting started to advanced risk management, our ever-growing library of helpful videos has you covered.